
Is the 'vibecession' really just the media?
Summarizing the ongoing debate and exploring possible explanations


Is the economy good or bad? A rather subjective assessment, don't you think? However, it is a rather important question to consider. If everyone thinks the economy is rough, people are going to change their behavior accordingly: save more, spend less. If everyone thinks the economy is great, no worries in spending a little bit more. Thinking of a large complex economy like ours, having groups of individuals change their behavior together could have large effects on the broader economy, as one person's spending is another person’s paycheck. Thus booms and busts!
Now, how would you determine whether or not the economy is performing well? Maybe you could take a look at some economic metrics like the unemployment rate, wages, prices, etc. One option is to simply ask a bunch of people their opinion about the economy. The University of Michigan's Consumer Sentiment Index is a survey that has been conducted since 1946, asking a representative sample of the US population how they think the economy is doing. You can learn more about the survey and the questions that are included in the index here.
There has been an ongoing debate for months in the ‘Econ Twitter’ space on a phenomenon coined the ‘vibecession.’ The ‘vibecession’ refers to the disconnect between consumer sentiment and economic metrics since the pandemic. Right now Americans are much more sour about the US economy than economic indicators would suggest. This could have large implications going into the 2024 election cycle as the type of political environment for Biden and Democrats could be summarized with four words: “it’s the economy stupid.”
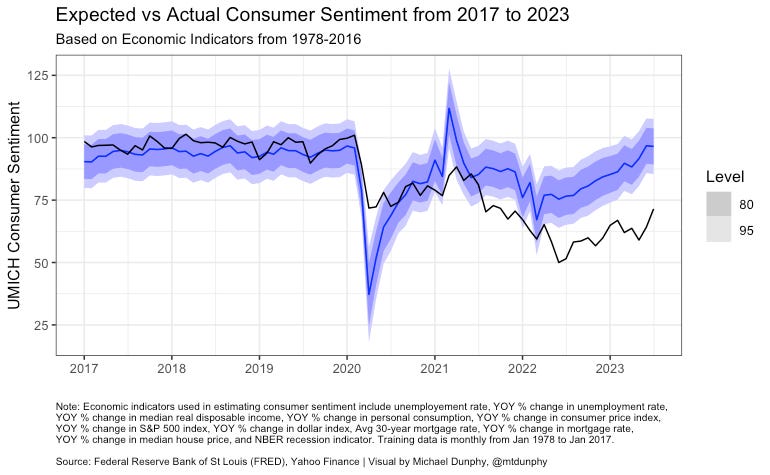
As you can see below, the consumer sentiment index is historically low, matching sentiment during the Great Financial Crisis of 2007-2008 and the last major battle with inflation in the early 1980s.
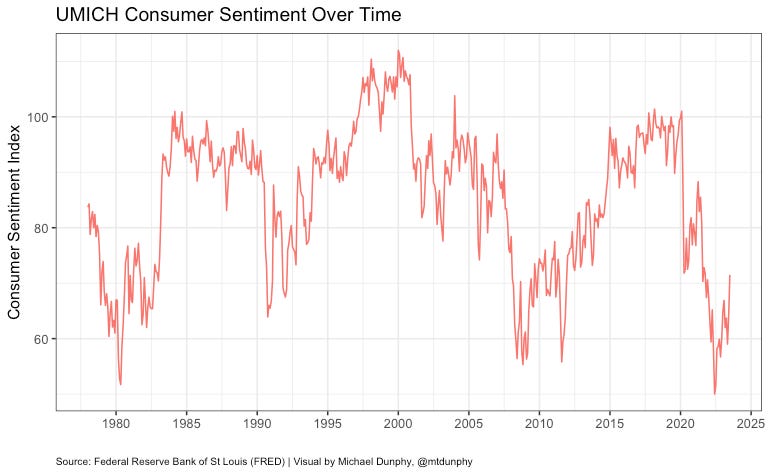
This is despite an unemployment rate of 3.7%, inflation continuing to come down to 3.1% from 8% in 2022, and a 4% increase in real disposable personal income compared to this time last year. People think their personal finances are in great shape, but when asked about the broader economy, opinions are much more pessimistic. What could be causing this disconnect?
This is what has recently perplexed economists and has spurred ongoing debate on Twitter. Last week, Nate Silver, the well-known ‘political data guru’ jumped into the ‘vibecession’ debate sparking a fun 72 hours of back-and-forth between those in ‘Econ Twitter’ and Nate Silver (and Nate’s followers).

(Worth noting, wages haven’t ‘significantly declined during Biden’s tenure’ even when taking inflation into account.)
Silver argues that given the uncertainty of the past few years, it should be expected that sentiment is historically low as the economy isn’t all that great for most Americans with rising prices and wages barely keeping apace.
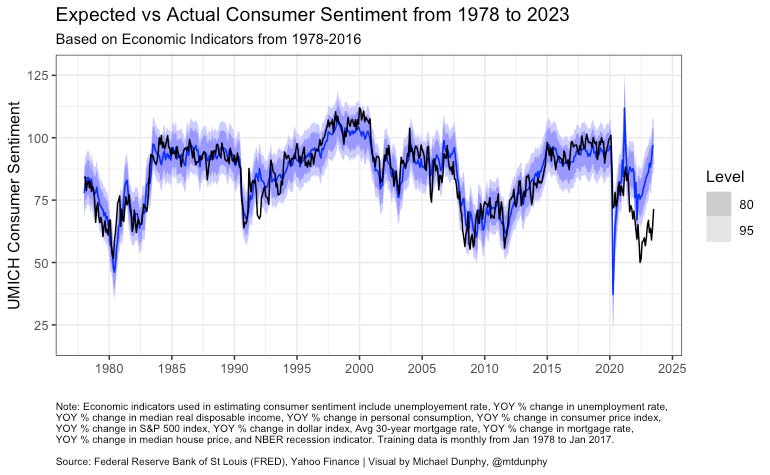
The only issue though is expected consumer sentiment is way off from actual sentiment when using a model based on economic indicators including inflation and wage growth. Expanding on the work of twitter user, Quantian and an article written in The Economist, I built a model based on economic indicators from 1978 through 2016 with similar results, expected consumer sentiment diverges from actual sentiment following the pandemic as you can see below. Blue represents expected consumer sentiment with 80% and 95% confidence bands and black represents actual sentiment.
People like Will Stancil, featured in the quote tweet by Silver, believe the news media and social media are the driving causes of the ‘vibecession’. Popular accounts in 'Financial Twitter (‘FinTwit’ for short) like the Unusual_Whales, Wall Street Silver, and The Kobesissi Letter have been predicting economic meltdown for over two years now as pessimism and fear are great ways to build a following and go viral on social media.
Legacy media like Fox News and the right-wing media sphere are politically motivated to paint the current economy as the worst in generations to hurt Biden’s re-election chances. Partisanship is certainly part of the story here as shown in the graph below by CBS News, but this isn’t new. Voters in the opposite party of the president tend to view the economy more poorly since the early 2000’s.

One idea I had was to gauge salience of issues using Google Search Trend data and see how the model changes when predicting consumer sentiment. If media is to blame for the dismal views on the economy, perhaps it can be demonstrated by what people are concerned with online.
As I have some time on my hands going into the holiday break, I decided to spend my morning gathering some data and building some models to see what I could find and to see if I could meaningfully contribute to the ongoing conversation. I decided to test the following keywords: “recession”, “interest rates”, “prices”, “inflation”, “layoff”, and “unemployment”. Search trend data is based on queries in the United States from January 2004, the start of google collecting search data, up to today.
I found that including search trend data along with economic indicators meaningfully narrowed the gap between expected and actual consumer sentiment following the pandemic. This indicates that people are more concerned over these topics than would be warranted based on the economic data alone suggesting media may be playing a role in amplifying negative views on the economy and thus producing unwarranted decreases in consumer confidence.
Below, I will outline the process and considerations made at each step of analysis. The data and code I used for this analysis can be found on github here.
Gathering Economic Data
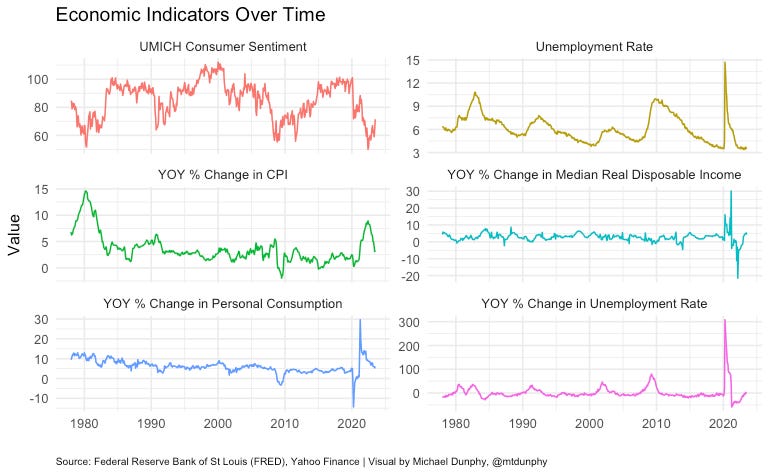
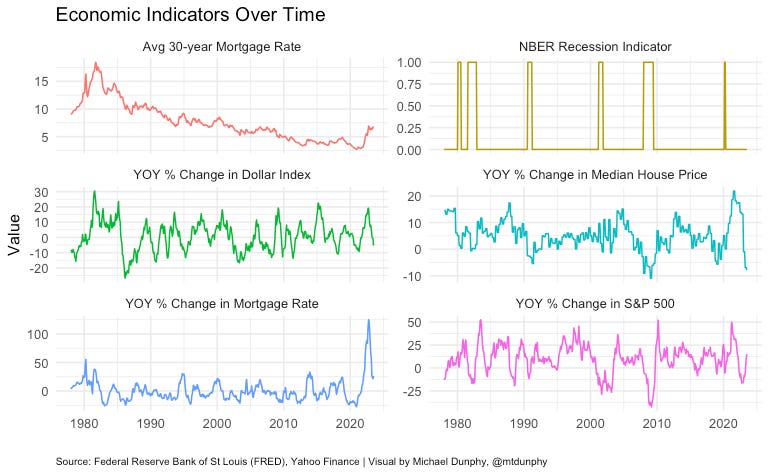
Economic data was collected from several sources including the Federal Reserve Bank of St Louis (FRED) and Yahoo Finance. I used the FRED API to get the following monthly economic data: the consumer sentiment index, the unemployment rate, the year-over-year percent change in unemployment rate, the year-over-year percent change in median real personal income, the year-over-year percent change in personal consumption expenditures, the year-over-year percent change in the Consumer Price Index, the average 30-year mortgage rate, the year-over-year percent change in mortgage rates, the year-over-year percent change in median house prices, and the National Bureau of Economic Research recession indicators.
Pulling from the Yahoo Finance API, I calculated the year-over-year percent change in the S&P 500 Index and and the year-over-year percent change in the US Dollar Index.
Year-over-year metrics are used to account for anchoring effects as people are likely to base their current views relative to some point in the recent past.
Below are the economic indicators plotted over time.
Using these variables, I created a time series regression from training data from January 1978 to January 2017 to predict consumer sentiment on testing data from 2017 onwards. The graph below shows the expected vs actual consumer sentiment from 2017 to 2023 with 80% and 95% confidence bands. As was noted earlier, you can see a large divergence between the two lines following the pandemic with actual consumer sentiment much lower than expected.
Looking at Google Search Trends
Now is time to include data from Google on the different keywords mentioned above. Google allows you to filter results by categories to make sure the data you are viewing is for the right version of the word. In this analysis, I included search data among all categories and among news categories to see if there is any difference between the words being used in all contexts or in news contexts.
The graph below shows the interest over time for each keyword among all categories in the United States. Results are normalized from 0 to 100 with 0 being no interest and 100 being max popularity.
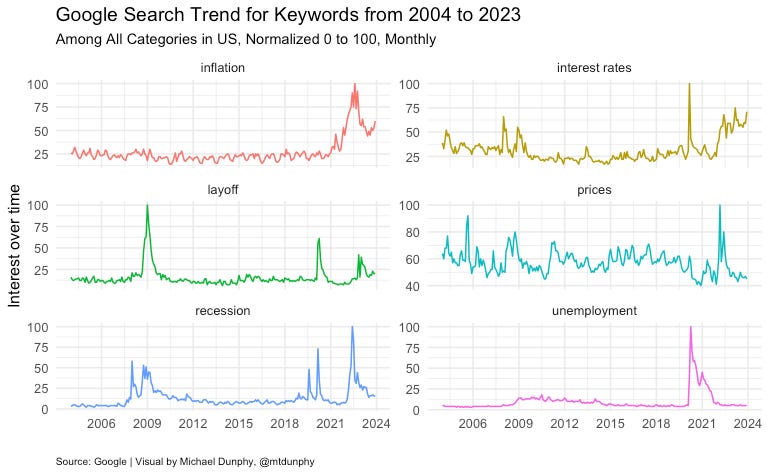
As you can see, keywords like “interest rates”, “inflation”, “prices”, and “recession” have had increased interest following the pandemic, with the latter three all peaking in popularity in the middle of 2022. The word “recession” had it’s maximum popularity in June of 2022, higher than during the 2020 recession or the Great Recession in 2008 and 2009, despite 2022 not experiencing a recession.
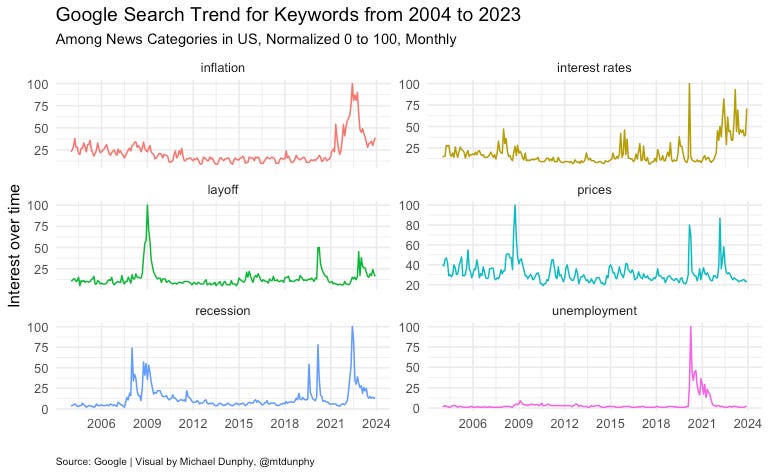
Looking at the results when filtering among “news” categories, you can see some deviation in interest over time, particularly for “interest rates” and “prices”.
Bringing It All Together
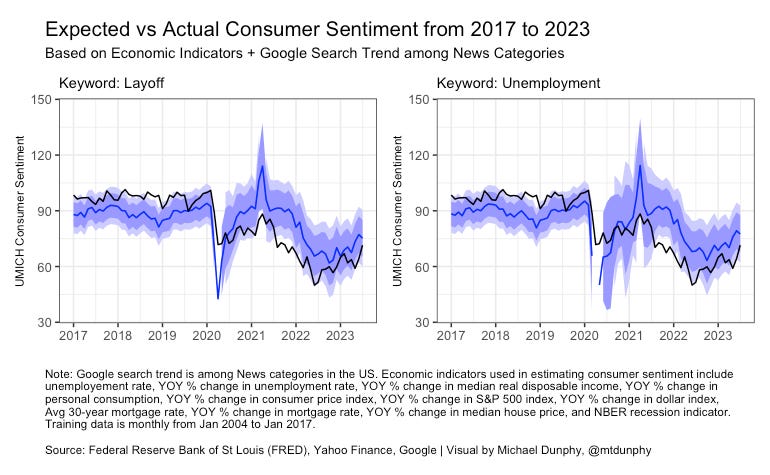
Combining the two data sets, I modeled consumer sentiment from January 2004 to January 2017 to see how predictions change with the google search trend data included with the economic data. The graphs below show the model predications with each keyword added to the economic indicators model.
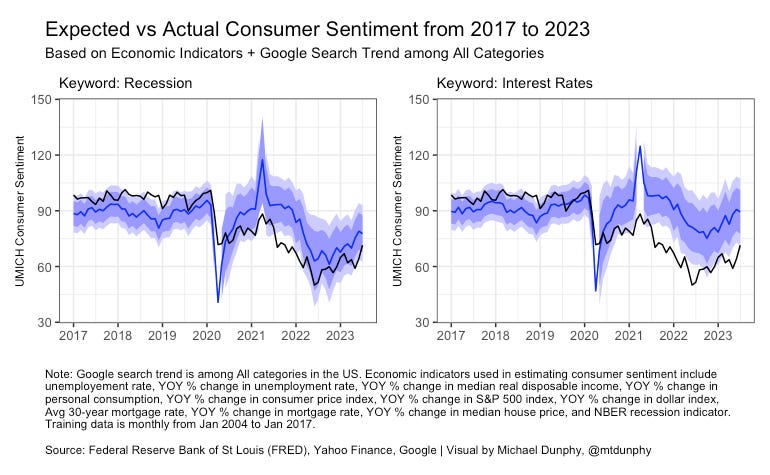
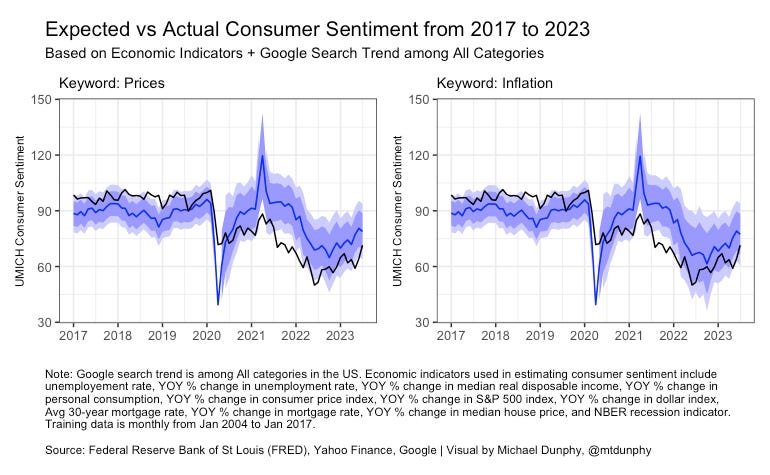
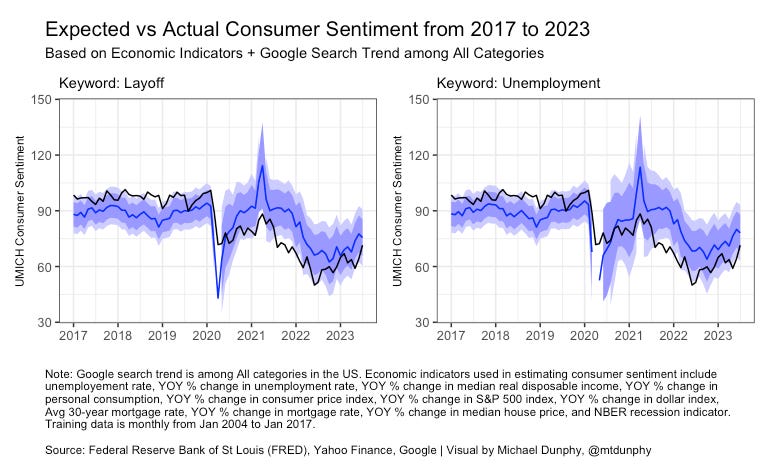
As you can see, each keyword had predictions closer to actual consumer sentiment than with modeling based on economic indicators alone. Keywords “inflation”, “recession”, and “layoffs” have the closest predictions in consumer sentiment following the pandemic.
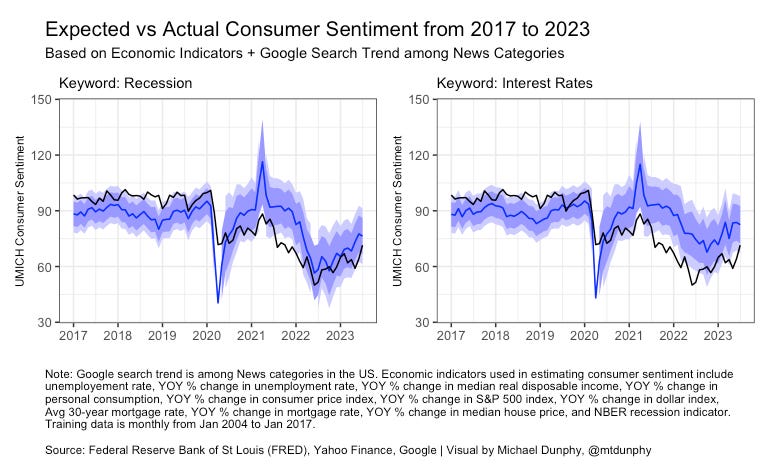
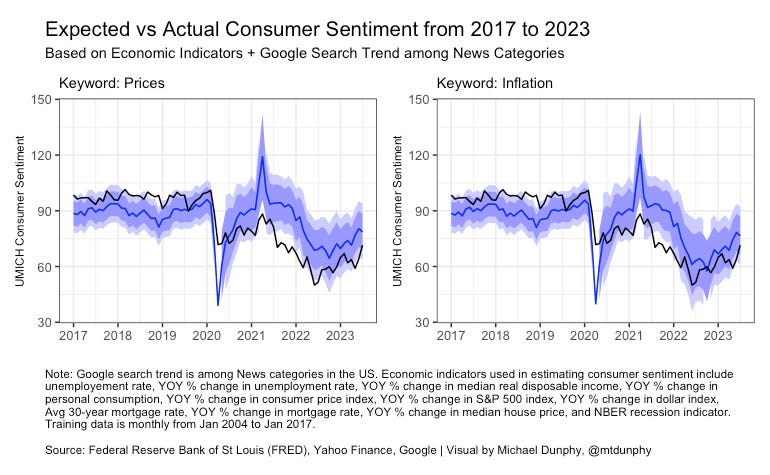
Using the google search trend data among “news” categories produces even closer predictions in consumer sentiment following the pandemic suggesting media is playing an active role in amplifying negative views on the economy and thus decreasing consumer confidence. As was the case looking at google search trends among all categories, keywords “recession”, “inflation” and “layoffs” produce the closest predictions despite not having gone through a recession, a rapid cooling in inflation, and a time of historically low number of layoffs in the economy.
Closing Thoughts
I think we all have experienced a rather tumultuous past several years with a pandemic, an attempted coup, a changing geopolitical landscape, and generationally high global inflation that has made people jaded and pessimistic about the future.
It is understandable people are sour during times of high uncertainty, but it doesn’t help that there are well oiled digital machines designed to prey on our worst instincts if it means spending just a few more seconds on an app who’s entire business model is to sell ads. Throughout human history, time and time again it has been shown that pessimism and fear mongering sell and today is no different. It’s just the reach is around the world in the matter of a single click.
Are the bad “vibes” warranted? Sure, inflation is a constant reminder every time you go to the store to buy something and see higher prices than expected. People have anchored expectations to before the pandemic, a time of low inflation and a rather healthy economy. It’s really as simple as the idea that happiness is the deviation from reality and expectations. People have high expectations and are looking for a return to how things were.
Debate over the Fed’s hard or soft landing in the news spells uncertainty for the future of the economy to the mass of people just going about their day-to-day. But again, are things today as bad as the Great Recession when unemployment was three times higher than today?
It is of increasing concern how people’s perceptions of reality can be warped so drastically to no longer reflect reality. If people are mad, they will find any cherry-picked evidence to justify their anger. It just so happens there are those online and in the media ready to give them just that.
Oh, the unemployment rate is low? The government must be faking the data.
Prices are higher at McDonalds because they have to pay higher wages to their staff? Time to overthrow the entire system.
I think the tide is turning now that inflation has significantly come down and the Fed is looking to start cutting rates next year. Time is needed for people to update their views with new positive information on the economy. People will start making comparisons relative to the lows of 2022 instead of the highs of 2019, bringing expectations back in line and hopefully returning the consumer sentiment index to a useful metric of tracking the real economy.
Caveat: Should the results of this analysis be taken as gospel? No, of course not. This was a rather quick analysis put together to practice my R skills and to create some pretty graphs. Any time series regression should be viewed with a large grain of salt as these models do not take into account interaction terms or confounding bias. Was it a fun exercise? Yes, and now I have another project to point to for demonstrating my capabilities in R. Thank you for reading!