


Good news for the US economy, inflation is coming down, unemployment remains historically low, and consumer sentiment is rising.
The Core Consumer Price Index (Core CPI) has shown inflation come down significantly from a peak of 6.6% in September 2022 to 4.0% last month (based on measuring annual percent change). Core inflation is a metric used by economists and policymakers as it is predictive of overall inflation in the future as Core CPI excludes items such as food and energy which historically have higher price volatility due to external factors abroad.
Below you can see how Core CPI has changed in the United States from 1958 to 2023 with data provided by the Federal Reserve Bank of St Louis (FRED). Grey shading indicates a recession classified by the National Bureau of Economic Research (NBER).
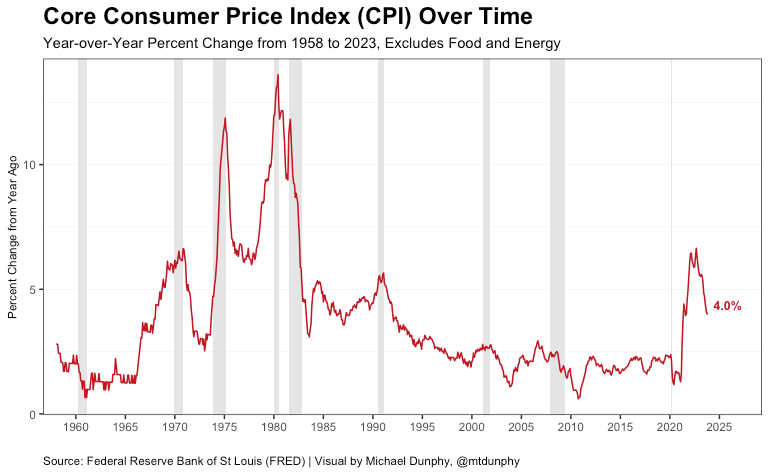
These past few months have shown even greater cooling of inflation with the past six months showing a 1.9% rate (right at the Fed’s target) with it being mostly driven by rent which is looking to decline even further in the future. The post-pandemic inflation appears to be in the rear view mirror.
The Federal Reserve is taking note of the positive data on the economy. Fed Chair Jerome Powell announced two weeks ago in a press conference following the Federal Open Market Committee’s (FOMC) December meeting that at least three rate cuts are to be expected next year. This has prompted many economists to claim victory of the elusive economic soft landing.
However, is this victory lap premature? Analyzing past rate hike cycles suggest the full effects of the Fed’s actions have yet to reverberate throughout the real economy. In this post, I look at the previous five rate hike cycles and see how it compares to the current Fed’s landing of the economic airplane. The data and code used in this analysis can be viewed here on GitHub.
What is a soft landing vs hard landing?
In the context of the Federal Reserve and the economy, the terms “soft landing” and “hard landing” refer to different scenarios that may unfold as a result of monetary policy decisions.
A soft landing occurs when the central bank, in this case the Federal Reserve, successfully engineers a slowdown in economic growth to to bring down inflationary pressures and stabilize the economy without triggering a significant increase in unemployment or a contraction in economic activity.
A hard landing, on the other hand, results in more severe economic downturn from efforts to control inflation or economic imbalances. As you can imagine, the former is much more sought after, but much more trickier to pull off.
The Federal Reserve, established in 1913 under President Wilson, operates under a dual mandate set by Congress, which includes promoting maximum employment and maintaining stable prices. Controlling inflation would be categorized under the latter.
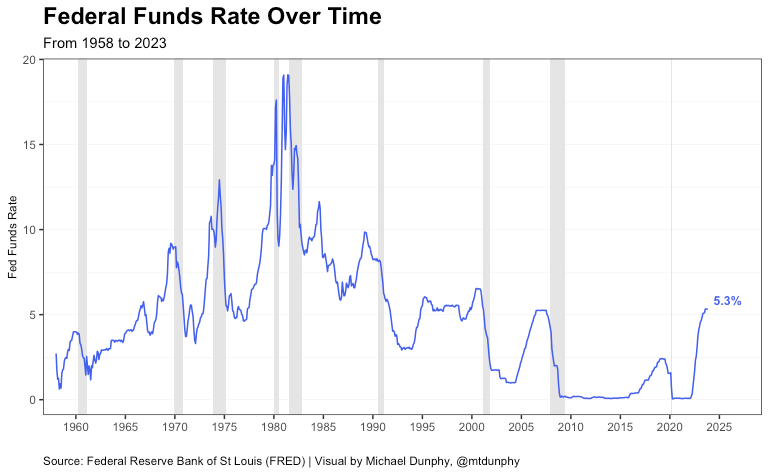
One of the tools the Fed has at is disposal is raising or lowering interest rates. To curb inflation or cool down an overheated economy, the Fed may raise the federal funds rate, the interest rate at which depository institutions (banks and credit unions) lend reserve balances to each other overnight within the United States Federal Reserve System. This makes borrowing more expensive and slows down economic activity.
Below you can see the federal funds rate over time from 1958 to 2023. The fed funds rate was at its highest in the early 1980s due to Fed Chairman Paul Volcker’s actions to bring inflation down seen in the previous chart. Today, the federal funds rate is 5.3%, a sharp increase from the close to 0% rate during and following the pandemic.
Now, these rates are nominal meaning the level of inflation is not taken into account. To calculate real interest rates, the interest rate must be subtracted from the rate of inflation. This provides a more accurate picture of the true impact rates have on economic activity. Higher real interest rates act like a brake in a car while lower rates act as an accelerator on economic activity.
Taking the two charts above, we can calculate the real federal funds rate over time below.
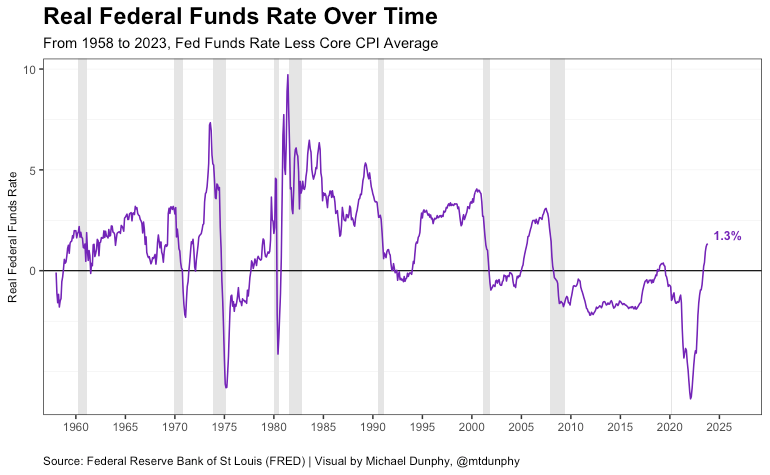
Since the Great Recession, the real federal funds rate has been below 0% meaning the rate of inflation is higher than the interest rate. This was by design to boost economic activity following the financial crisis and raise the inflation rate closer to the Fed target of 2%.
As inflation spiked following the supply shock created by the pandemic, the Fed began to increase rates to combat rising prices and cool an overheating economy. Since June of this year, the real rate has surpassed 0%, now reaching 1.3% last month, the highest since 2008.
A consequence of higher interest rates slowing down the economy is the potential for a negative feedback loop leading to high unemployment and a recession. As borrowing costs increase, demand decreases leading to layoffs which can lower demand further and so creating an even greater contraction in economic output than anticipated. Thus, a hard landing.
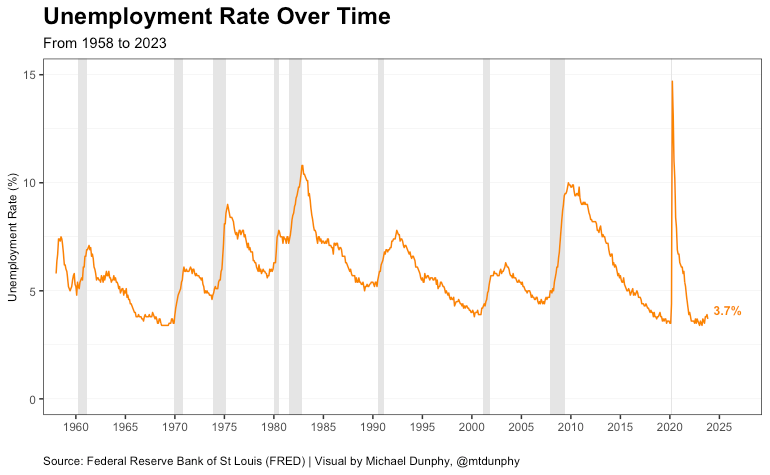
The Federal Reserve endeavors to avert recessions, given that maximizing employment is integral to its dual mandate; however, there are instances where prioritizing price stability may take precedence over this goal. This was the case during the Volcker recessions in the early 1980s to anchor expectations that the Federal Reserve will do what is necessary to keep inflation low.
Below is the unemployment rate from 1958 to 2023. You can see unemployment rises sharply in the 80s following the Fed’s actions of hiking rates to nearly 20% in 1981. Today, unemployment is historically low at 3.7%, a swift recovery from the nearly 15% unemployment rate in April 2020.
Looking at previous rate hikes, we may be able to gain insight into what could be expected following the Fed’s most recent actions.
Analyzing Previous Rate Hike Cycles
Looking at the past 35 years (1988 to 2023), there have been five other rate hikes: 1988 to 1989, 1994 to 1995, 1999 to 2000, 2004 to 2006, and 2015 to 2018. Among these past rate hikes, three (‘88-’89, ‘99-’00, and ‘04-’06) have resulted in significant increases in unemployment and a recession.
The 2015 to 2018 hike was long and gradual due to low inflation and a slow recovery following the Great Financial Crisis, but its effects on the economy were cut short due to the exogenous impact of the COVID-19 pandemic.
This leaves one remaining rate hike, 1994 to 1995, which was characterized as a “soft landing” at the time as it did not result in increased unemployment or a recession. I may look closer at this period to better understand why this turned out to be the case in a future post.
The graph below shows the change in federal funds rate for each of the rate hike cycles from 1988 to 2023. As you can see, the most recent actions by the Fed have resulted in the largest and quickest rate hike in the last 35 years.
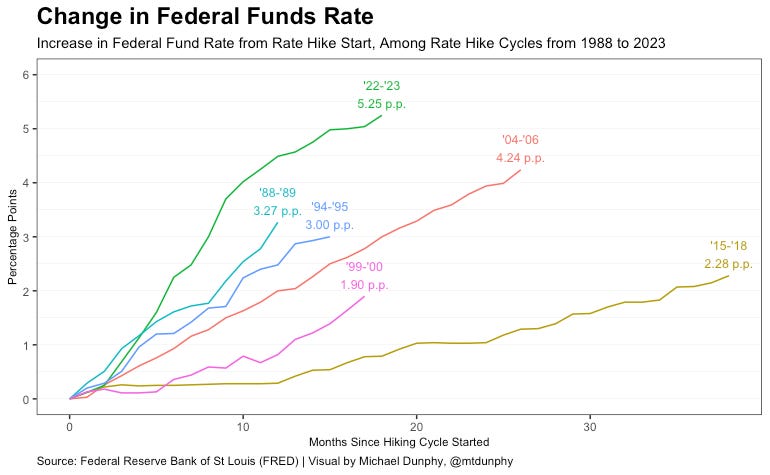
As data comes in showing a cooling economy, the Fed will pause rate hikes and eventually bring rates back down to neutral (a real rate closer to 0%) so that it no longer acts as a drag on economic growth. This is what the Fed is looking to do next year.
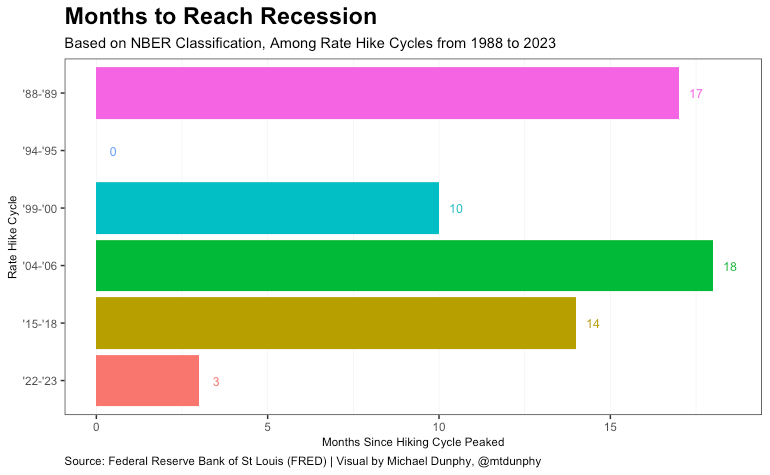
The graph below shows the number of months it took from when the Fed stopped raising rates to when a recession started. The period of time ranges from 10 months following the ‘99-’00 rate hike to 18 months following the ‘04-’06 hike. As mentioned before, the ‘94-’95 rate hike resulted in no recession and ‘15-’18 is unique due to the pandemic.
The Fed stopped raising rates in August of this year, just 3 months ago. This means that the full effects of higher rates may yet to be seen in the broader economy.
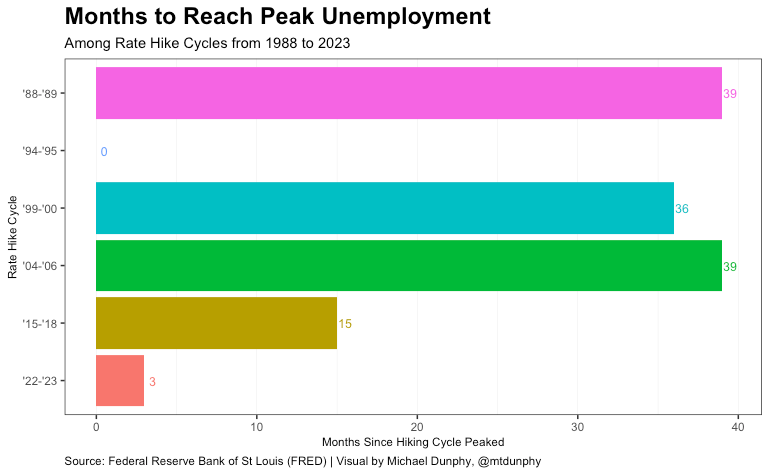
Looking at when the unemployment rate reaches it’s highest point following the peak of the rate hike cycle, the number of months extend further to 36 months for the ‘99-’00 hike to 39 months for both the ‘88-’89 and ‘04’-06 rate hikes. If we are to expect higher unemployment from increased borrowing costs, we may be waiting for a while.
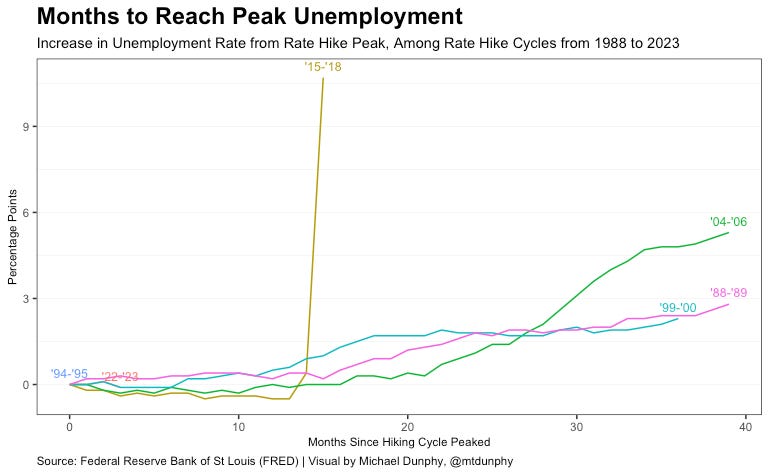
Below is the graph showing the increase in the unemployment rate following the peak in the rate hike cycle, further demonstrating the lagged effects of the Fed’s actions on the real economy. To reiterate, the rise in unemployment following the ‘15-’18 hike was the result of the supply shock caused by the pandemic.
Closing Thoughts
High inflation, a phenomenon not experienced in a generation, has been able to come down significantly in recent months. However, getting from 3% back to the 2% target without hurting the economy may be an even greater challenge for the future.
Is it too soon to claim victory of a soft landing? Perhaps, as the Fed’s actions next year determine whether we remain on the soft landing path or detour into ‘no landing’ or ‘hard landing’ paths. Economist Brad DeLong is already warning that the Fed may now be behind the curve in easing rates as PCE came in negative last month.
Given that we still have a potentially long way to go to get inflation completely back to normal, this should not take away the amazing achievement the Fed has done so far, anchoring expectations and reestablishing its credibility to tackle inflation all while maintaining a historically hot labor market.
As we head into the 2024 election cycle, it is great news that the Fed has been able to walk the tightrope so far with more people finally taking notice. As is always the case, the journey ahead remains uncertain, but we may have the benefit of some warranted optimism.